.png)
Use Open Source software using Prometheus and Grafana

Metrics are a critical aspect of any system to understand its health and operational state. Design of any system requires collection, storage and reporting of metrics to provide a pulse of the system. We explore how tsdb, prometheus and grafana form that stack for open source metrics reporting in Kubernetes.
Data is stored over a series of time intervals and needs an efficient database to store and retrieve this data.
OpenTSDB Time Series Database is one such time series database that can serve that need.
While data is stored in a time series database, a standard system to scrape such metrics and store it in the database has emerged in form of Prometheus . When a data source exports metrics in prometheus exposition format, it can be scraped by prometheus. While time series database stores metrics, Prometheus collects the metrics and pushes them in the database.
Any database also needs an efficient and programmer friendy way to query information, eg: SQL for popular transactional databases like Postgres and MySQL. Prometheus defines a rich query language in form of PromQL to query data from this time series database.
Any form of reporting solution isn't complete without a graphical component to plot data in graphs, bar charts, pie charts, time series and other mechanisms to visualize data. Grafana serves this need where it can take a data source (like Prometheus) and provides the programmability and flexibility to display data in a form that is useful to the user. Grafana also supports several other data sources
We broadly cover how the different systems work in tandem, what makes them stick together, some detail of each sub-system and tracing a variable from end-to-end to gain a clear understanding.
EnRoute is built using Envoy proxy and both sub-systems provide a prometheus endpoint to scrape/export the operational metrics in the system.
This section describes how prometheus monitoring system uses service discovery to scrape data (using scrape configuration) and store it in TSDB (prometheus time series database). We then describe how Grafana uses PromQL to query this data.
Prometheus collects metrics using the pull model. Prometheus needs a port and path to scrape data from. How does it find that? This problem is addressed by Prometheus service discovery.
You can set the instance port and path to scrape in a prometheus config file. With dynamic environments like kubernetes where endpoints, ip-addresses, services, pods, containers are transient, a static configuration won't work. A more dynamic approach is using service discovery and providing instructions about how to work with discovered services. This is where prometheus service discovery can be configured to discover instances (or job which is a collection of instances).
Service Discovery in Prometheus can work in severl different environments. Example environments include Kubernetes, Azure, Digital Ocean and several other options. A complete set of service discovery options can be found on prometheus configuration reference . The <*_sd_config> are all different environments in which prometheus has built-in support and can be configured for service discovery.
Service discovery returns a list of instances to scrape metrics from. The discovery process may also discover additional metadata about the discovered instances. This additional metatdata may be used by the user to ignore, filter, customize or to add attributes to the collected data. Prometheus uses a relablelling mechanism to achieve that.

In the example above from prometheus github , the configuration file for prometheus specifies kubernetes service discovery using kubernetes_sd_config directive. Note how relabelling can be used to ignore certain instances and replace variable names.
Prometheus also shows the list of targets that it has discovered on the /targets endpoint

The first requirement for the system to work is how variable state or metric is reported. When a system that has metric to report, it is broadly classified as the type of data which is either a counter that monotonically increases or a gauge that can increase or decrease over time.
Such a distinction at the source of where the metric is generated is required to facilitate the metric stack to correctly query, store and retrieve data.
If an application does not export metrics in Prometheus Exposition Format, there are libraries to convert metrics to this format. Prometheus also has several libraries in different languages that help facilitate defining the variable type, operating on it and exporting it.
OpenTSDB supports a multi-dimensonal data model where a data point can be identified using a name and key/value pairs. As an example, let us consider the data model with an example.
When a request traverses through Envoy, it is proxied and connects to an upstream to serve the request. One such variable for upstream stats is envoy_cluster_upstream_rq.
The figure below shows prometheus exposition format that is used as an export format for the metric flows over the wire:

We can GET the information about this variable in Envoy from /stats/prometheus url of envoy stats endpoint:
Note the TYPE that tells prometheus (and the prometheus time series database) about the type of variable. counter is one type of variable supported by prometheus.
This variable envoy_cluster_upstream_rq is stored in OpenTSDB , which in addition to the value of the variable stores a timestamp and key/value pairs. These key/value pairs facilitate querying of data. The following are all valid queries -
To better understand how a tool like Grafana can pull data from Prometheus/TSDB, we need to understand how data once stored in TSDB is queried.

Note that data variables hold not only time-series value but also an associated key/value. These attributes can be used for querying (eg: envoy_response_code key). This querying is what makes it powerful. There are several ways to look at the same data. While envoy instance from which data was scraped may report a couple of dimensions (or additional key/value tags), additional tags may be added by Prometheus. For instance Prometheus adds kubernetes metadata like service (eg: service key), namespace (eg: kubernetes_namespace key), pod-name, endpoint info etc. when it scrapes and stores information from an instance. All this additional tags can be used to query the data.
The query language to support rich set of use-cases is critical, and PromQL provides that flexibility. We quickly take a look at how to use PromQL to form queries. More details about PromQL can be found on the prometheus PromQL
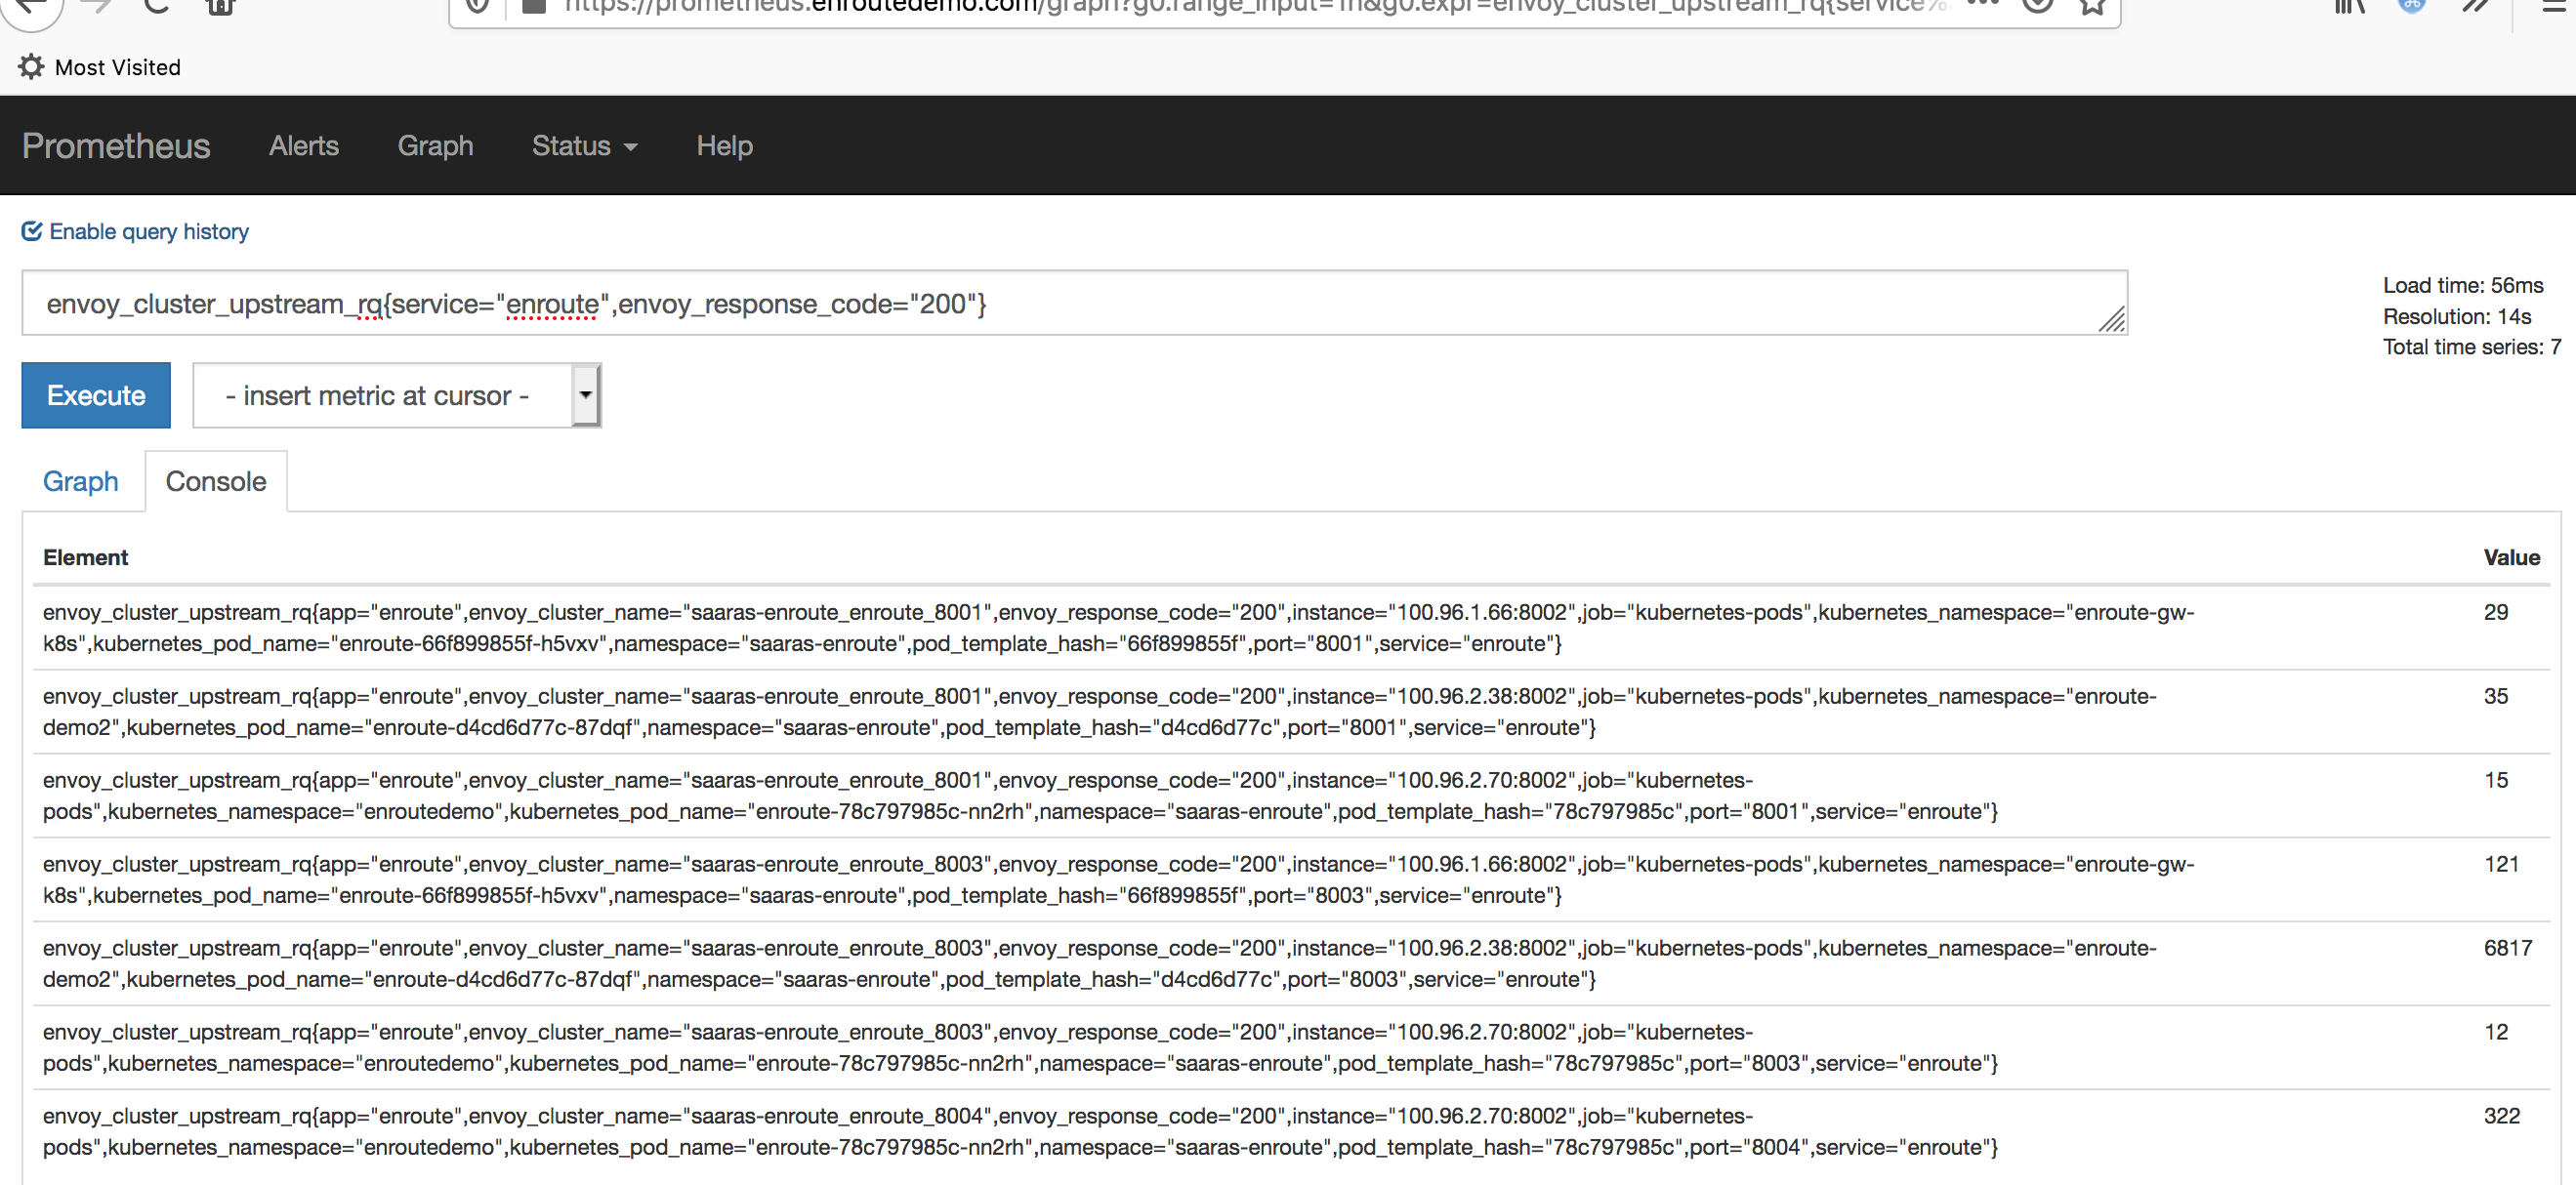
Going back to the original variable envoy_cluster_upstream_rq, it counts the number of upstream requests for clusters. Here are several ways to get this counter:


Note that the above value is time series data. The above is a fairly simple example. While querying a time series the offset, duration, subquery, aggregation, function and other qualifiers can be used to extract more fine-grained data. For example, you can dump the [30m] rate of this time-series:

More detailed examples can be found on prometheus documentation reference
Prometheus system offers a few core metric types that are supported by the system.
A detailed explaination of these variable types can be found on prometheus section on variable types
EnRoute OneStep is both a lightweight shim on Envoy. It can work as a lightweight control plane to program Envoy Proxy as an Ingress Controller. It also functions without Kubernetes. It provides a cache for Envoy configuration that can help configure the proxy. It exports metrics that are relevant to the internals of the cache it maintains to serve Envoy. Additionally, it has has metrics about other subsystems that work in tandem to provide API security.
A lot of interesting state and metrics data is provided by Envoy. A proxy like Envoy has several sub-systems that exports a lot data. We won't look at all the metrics but high level components and the data they export. The Envoy documentation reference provides a complete list of stats exported.
Grafana is an open source tool to build an observability dashboard. The primary abstractions used to build a UI in grafana is a Dashboard that is made up of several Panels. A panel embeds a query that pulls the data to be displayed and various styling and formatting options.

An intermediate step between querying and visualizing the results of a query is transformation. As the name suggests, transformation provides a mechanism to work on the data before it is passed to visualization.
The monitoring dashboard and panels are perodically updated with the latest data (where the refresh frequency can be controlled in Grafana)
Grafana supports several data sources one of which is Prometheus.
In Grafana, you build graphs using Visualizations. Visualizations roughly map to displaying data types defined earlier in Prometheus eg: counter, gauge, histogram and summary. There also is flexibility in how they are displayed as graphs, bar charts as tables or heatmaps.
A more detailed explaination of Dashboard , Panels , Querying, Transformation and Visualizations can be accessed from the Grafana website.
Here is an example Grafana Dashboard that is made up of panels -

The dashboard is made up of 12 panels across 3 rows and 4 columns. Each panel has a query to pull data from a data source. The panel also has a JSON representation in grafana. Here is one such representation for Downstream 2xx Responses
The representation above has a lot of fields removed just to highlight the interesting ones to build an understanding of how a variable reported in enroute/envoy is displayed. The interesting parts are datasource and the targets.expr that captures the query. Note the PromQL syntax and how the cumulative value of 1m rate is plotted over time.
The query:
fetches the value of envoy_http_downstream_rq_xx for a reponse code 2xx
Here is another example that plots a histogram of latency to upstream server after importing swagger spec using enroutectl.

EnRoute Universal API Gateway with its API both for Standalone and Kubernetes works with Prometheus and Grafana based open source telemetry. Both EnRoute and Envoy can export operational data in Prometheus Exposition Format. Telemetry is critical for operations and using an open source format like Prometheus and Grafana ensures that programmable insights can be derived from data and the API gateway adheres to the overall logging architecture and choices.
When working with a complex system, any downtime is unacceptable. Understanding the root cause requires metrics to understand and troubleshoot. Logging and monitoring are critical to ensure the DevOps team has the necessary tools to keep the system running. EnRoute Universal API Gateway automatically creates detailed dashboards for individual Envoy components to provide deep insights into working of several API Gateway sub-systems. These Envoy specific dashboards can also be displayed on a per-service basis using relevant Envoy metrics.


